After a 17-13 defensive opener in Week 1, the market has lifted the total to 49.5 for the rematch. This preview evaluates the total angle and the narrow spread in a matchup featuring two quarterbacks playing at an MVP level.
Market Analysis: A Tight Line Tells the Truth
The market opened this NFC West title game with Seattle laying 1.5 on the road and never flinched. In a primetime divisional matchup with playoff seeding on the line, that kind of stability matters. When the opener holds in a game this visible, it usually means the number is already where it belongs.
The total tells a different story. Opening at 48.5 and settling at 49.5, the market clearly expects more offense than the 17-13 slugfest these teams played in Week 1. That early-season result is still driving public perception, but the number reflects two offenses that look nothing like they did four months ago.
Both teams enter on six-game winning streaks, removing recent form as a separating factor. Instead, this line is built on efficiency. Seattle’s 29.4 points per game (#2) against San Francisco’s 22.4 allowed (#13) justifies the short favorite, while the 49ers’ elite third-down efficiency keeps the margin tight.
The moneyline confirms it. Seattle -115 versus San Francisco -105 prices this as a near coin flip, with home field doing most of the work for the 49ers. This isn’t a line designed to invite action — it’s a line reflecting balance.
Game Information
Seattle Seahawks at San Francisco 49ers
When: 8:00 PM ET, Saturday, January 3, 2026
Where: Levi’s Stadium, Santa Clara
TV: ESPN
Point spread: Seattle -1.5 (-110) / San Francisco +1.5 (-110)
Money line: Seattle -115 / San Francisco -105
Total: 49.5 (Over -115, Under -105)
How the Market Is Separating These Teams
Seattle opened favored and stayed there. That matters. In a spot where backing the home team would be the comfortable play, the market refused to budge.
The total climb from 48.5 to 49.5 signals clear disagreement with the Week 1 result. When a number moves a full touchdown above a previous meeting, it’s the market acknowledging real offensive growth on both sides.
The spread sitting at 1.5 avoids key numbers entirely, suggesting confidence in a narrow edge rather than volatility. That typically happens when efficiency metrics, not emotion, are driving the price.
Seattle’s 0.496 points per play (#1) against San Francisco’s 0.373 allowed (#16) provides that edge. When the most predictive efficiency stat shows that kind of gap, laying a short road number becomes viable.
Matchup Levers That Matter
The defining battle is third down. San Francisco converts at 50.98% (#1). Seattle allows just 32.44% (#1). Something has to give.
Historically, elite third-down defenses hold up better than elite offenses in these matchups, especially on the road. Getting teams off the field shortens games and limits explosive runs.
Red-zone efficiency leans slightly Seattle. The Seahawks convert 57.14% of red-zone trips, while San Francisco allows touchdowns at a 50.98% rate. That margin isn’t massive, but in a one-score game, it matters.
Turnovers don’t create a clear separator. Seattle generates 1.5 takeaways per game (#5), while San Francisco gives it away 1.0 times per game (#22). This isn’t a reckless matchup, but it isn’t immune to momentum swings either.
Seattle’s commitment to the run shows up in volume. Their 29.3 rush attempts per game (#6) against San Francisco’s 24.1 opponent rush attempts (#5) points toward tempo control, even if efficiency stays modest at 4.1 yards per carry (#25).
Quarterback Context
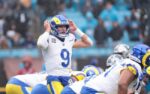
Sam Darnold has been efficient without needing to carry the offense. His 231.0 passing yards per game paired with a run-heavy approach keeps Seattle balanced, though his 3.30% interception rate (#28) remains the one pressure point.
Brock Purdy has been cleaner. His 69.29% completion rate (#2) and 7.7 yards per pass (#7) highlight consistency, and his 13 total touchdowns over the last three games reflect peak form. The challenge is Seattle’s defense allowing just 6.1 yards per pass (#1).
George Kittle’s questionable ankle status matters. San Francisco’s 66.15% red-zone touchdown rate (#2) leans heavily on his short-area mismatch ability.
Venue & Conditions
Levi’s Stadium presents no environmental obstacles. Protection should hold, with Seattle allowing a 5.21% sack rate (#9).
Seattle’s 7-1 ATS road mark shows comfort in hostile environments, particularly divisional ones where familiarity reduces home-field impact.
Bryan Bash’s Multi-Angle Strategy
Primary Investment: Seattle -1.5 (-110) – 1.5 Units
This is an efficiency play. Seattle owns the edge in points per play, third-down defense, and road performance. The line reflects that without overpricing it.
San Francisco is excellent, but the market has correctly identified Seattle as the slightly cleaner team in the areas that decide tight games.
High-Value Alternative: Under 49.5 (-105) – 1 Unit
The market lifted this total aggressively, possibly a step too far. Divisional familiarity, elite third-down defense, and Seattle’s run-heavy tendencies all point toward fewer clean scoring possessions than the number implies.
Player Props Portfolio:
Christian McCaffrey Anytime TD (-200) correlates with San Francisco’s red-zone profile and serves as a hedge against the Seattle side.
Kenneth Walker III Anytime TD (+130) fits Seattle’s ground volume and red-zone usage.
Live Betting Strategy:
Watch early third-down outcomes. If Seattle consistently gets stops, second-half unders gain value. If San Francisco sustains drives early, the live total may still offer over opportunities.