 – 2026-03-18")
Bash is ignoring the sexy 31-1 record and backing the battle-tested ACC squad in this 11-vs-11 First Four showdown. The adjusted efficiency gap tells a completely different story than Miami’s gaudy win total.
The Line That Doesn’t Add Up
No. 11 seed Miami (OH) is laying 6.5 points against No. 11 seed SMU at 9:15 PM ET Wednesday from UD Arena in Dayton, and I’m here to tell you this number is backwards. The RedHawks bring a 31-1 record and the #2 scoring offense in the country at 90.7 points per game, but when you dig into the collegebasketballdata.com numbers, this is a classic case of mid-major inflation meeting Power 5 reality. SMU sits at 20-13, but those 13 losses came against an ACC gauntlet that ranks #27 in strength of schedule. Miami’s MAC schedule? Let’s just say there’s a reason their adjusted net rating sits at +9.8 compared to SMU’s +19.6. This is a NCAA Tournament First Four matchup where conference pedigree and metric depth matter more than surface records, and the market is giving us a gift.
Why the Market Landed Here
The 6.5-point spread favoring Miami (OH) is pure public perception riding that 31-1 record and the #20 AP ranking. But here’s what the market missed: SMU ranks #26 nationally in adjusted offensive efficiency compared to Miami’s #62. On the defensive side, the Mustangs check in at #77 while the RedHawks sit at #150. That’s a 9.8-point net rating advantage for SMU in a neutral-site NCAA Tournament environment where home-court inflation disappears. The total of 163.5 makes more sense when you consider Miami’s nation-leading 133.5 offensive rating, but that number was built against MAC competition. SMU’s #27 strength of schedule versus Miami’s mid-major slate creates a massive context gap. Warren Nolan’s RPI data confirms it: SMU sits at #48 RPI with a #27 SOS, while Miami’s gaudy record was constructed against significantly weaker opposition. The Mustangs went 2-9 in Quadrant 1 games because they actually played elite competition. This line should be a pick’em at worst.
The Bubble Motivation Factor
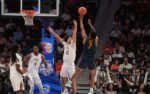
SMU enters this First Four game with something to prove after an 8-10 ACC conference record that included losses to Louisville, Florida State, Miami, and Stanford down the stretch. But here’s the thing about Andy Enfield’s squad: they rank #26 in adjusted offensive efficiency and #41 in true shooting percentage at 59.1%. Boopie Miller leads the way at 20.6 points per game with 6.8 assists, giving the Mustangs an elite pick-and-roll operator. Jaron Pierre Jr. adds 19.5 points per game, and this backcourt duo has seen every defensive look imaginable in ACC play. The Mustangs’ 55.7% effective field goal percentage ranks #31 nationally, built against legitimate competition. I’m not worried about the 20-13 record when the losses came in the nation’s toughest conference. This is a team that knows how to execute in March.
The MAC Reality Check
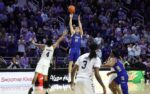
Miami (OH) has been dominant, no question. That 52.4% field goal percentage leads the nation, and their 61.2% effective field goal percentage is equally impressive. Evan Ipsaro’s absence due to a knee injury removes their leading scorer at 14.8 points per game, but the RedHawks have depth with Brant Byers (12.6 PPG) and Peter Suder (12.4 PPG) picking up the slack. Here’s my concern: their only loss came to Massachusetts, and they needed overtime to beat Ohio at 110-108. Their Quadrant record against tournament-level competition is virtually nonexistent. SMU’s 2-9 Q1 record might look ugly, but it means they’ve been in nine elite-level battles. Miami’s #150 ranking in adjusted defensive efficiency is a massive red flag against an SMU offense that ranks #49 in offensive rating and #31 in effective field goal percentage. The pace differential matters too—Miami plays at 65.0 possessions while SMU pushes it to 69.3. In a neutral-site NCAA Tournament game, that tempo edge favors the more athletic, battle-tested squad.
The Metrics That Matter
| Metric | SMU | Miami (OH) |
|---|---|---|
| KenPom Rank | #42 | data pending |
| RPI Rank | #48 | data pending |
| Strength of Schedule | #27 | data pending |
| Quadrant 1 Record | 2-9 | data pending |
| Adj. Net Rating | +19.6 (#38) | +9.8 (#86) |
| Adj. Offensive Efficiency | 123.4 (#26) | 117.8 (#62) |
| Adj. Defensive Efficiency | 103.7 (#77) | 108.1 (#150) |
The style clash here creates separation. Miami’s 65.0 pace ranks #268 nationally—they want to grind possessions and execute in the halfcourt. SMU’s 69.3 pace (#67) and 16.9 assists per game (#28) suggest they’ll push tempo and create transition opportunities. The Mustangs’ 32.6% offensive rebounding rate (#95) versus Miami’s weak 23.4% mark (#357) means second-chance points will tilt heavily toward SMU. B.J. Edwards’ questionable status with an ankle injury is worth monitoring—he contributes 13.0 points and 5.6 assists per game—but even without him, this roster has the depth and experience edge. The projected 67.2 possessions favor SMU’s ability to generate quality looks against a defense that ranks outside the top 150 in adjusted efficiency.
The Bottom Line
BASH’S BEST BET: SMU +6.5 for 2 units.
I’m taking the points with the better team in a neutral-site NCAA Tournament environment. The 9.8-point adjusted net rating gap is real, and Miami’s defensive vulnerabilities at #150 nationally will get exposed by an SMU offense that ranks #26 in adjusted efficiency. The only risk here is if Miami’s shooting variance continues—that 52.4% field goal percentage and nation-leading offensive rating can steal games—but I trust SMU’s ACC-tested defense to force them into tougher looks than they saw all season in the MAC. This line should be a pick’em, and we’re getting nearly a touchdown. The Mustangs have the metrics, the experience, and the matchup advantage to win this game outright. Give me Andy Enfield’s squad to punch their ticket into the Round of 64.