Bradish’s strikeout metrics tell one story — the -143 price tells another. Early’s surface success masks a peripheral gap that makes this number feel disconnected from the actual pitching profiles.
Connelly Early vs Kyle Bradish: Boston Red Sox at Baltimore Orioles Betting Preview
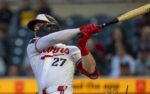
The market sees a pitching edge for Boston with Connelly Early‘s 2.88 ERA against Kyle Bradish‘s 3.96 mark, but the peripherals tell a different story. Bradish owns superior strikeout metrics (10.08 K/9 vs 8.64) and better command indicators that suggest his inflated ERA masks stronger underlying performance.
Baltimore enters with a .725 OPS compared to Boston’s .667 mark, showing offensive superiority that extends beyond yesterday’s collapse. The question becomes whether the -143 price adequately reflects these underlying advantages or if the market is still adjusting to Early’s small-sample success.
Game Info & Betting Lines
- Date/Time: Sunday, April 26, 2026 at 1:35 PM ET
- Venue: Oriole Park at Camden Yards (Park Factor: 1.01)
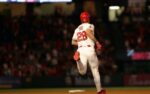
- Probable Starters: Connelly Early vs Kyle Bradish
- Moneyline: Boston Red Sox +119 / Baltimore Orioles -143
- Run Line: Baltimore Orioles -1.5 (+149) / Boston Red Sox +1.5 (-181)
- Total: 7.5 (Over -112 / Under -108)
Why This Number Feels Steep
The market is pricing Early’s 2.88 ERA as the primary edge, and legitimately so — he’s been effective through 25 innings with solid command metrics. But digging deeper reveals potential overvaluation based on a small sample against mediocre competition.
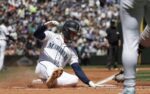
Here’s my concern with laying -143: Bradish’s peripheral metrics suggest significantly better performance than his ERA indicates. His 10.08 K/9 rate creates more swing-and-miss than Early’s 8.64 mark, while both pitchers carry similar walk rates around 4.7 BB/9. The strikeout differential becomes amplified when Baltimore’s offensive metrics (.725 OPS, 32 HR, 122 runs) consistently outpace Boston’s production (.667 OPS, 18 HR, 112 runs).
The -143 price feels like the market overreacting to Early’s early success while undervaluing Bradish’s superior arsenal depth. But is that enough edge to justify the juice?
What Separates the Pitching
The arsenal breakdown reveals why Bradish’s peripherals matter more than his surface numbers. His slider sits at 35.4% usage with a 31.3% whiff rate and holds opponents to just .261 xwOBA — a dominant secondary pitch that creates consistent strikeouts. Early’s approach spreads across six different offerings, with his most-used four-seam fastball at 32.1% generating a concerning .439 xwOBA against.
Bradish’s sinker-slider combination (64.8% combined usage) creates a cleaner attack plan than Early’s more scattered approach. The velocity gap favors Bradish slightly (94.7 mph sinker vs Early’s 94.1 four-seam), but the real separation comes in put-away ability. Bradish’s curveball generates a 42.6% whiff rate compared to Early’s 26.7% on his curve.
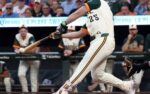
Early does possess one weapon in his sweeper (33.3% whiff rate, .143 xwOBA), but at just 5.8% usage, it’s more of a show pitch than a genuine strikeout option. The matchup data shows Willson Contreras with a .496 xwOBA and 8.3% barrel rate against Bradish’s arsenal — Boston’s best individual mismatch in what otherwise projects as a pitcher-friendly environment.
The Pushback
Early’s 2.88 ERA isn’t a mirage — he’s legitimately pitched better than Bradish this season with a positive 0.57 WAR compared to Bradish’s -0.07 mark. The Red Sox also just exploded for 17 runs yesterday, showing offensive upside potential that could indicate a breakout series.
But here’s what genuinely worries me about taking Baltimore at this price: both teams carry identical -13 run differentials with matching 4-6 records over their last ten games. The statistical profiles suggest these teams are closer than the seasonal offensive numbers indicate. Early’s changeup has been legitimately effective (23.9% whiff rate, .333 xwOBA) as a second pitch, and Boston’s lineup includes Wilyer Abreu (.408 xwOBA) who profiles well against Bradish’s slider-heavy approach.
The market might be correctly pricing Early’s small sample dominance, making -143 an accurate reflection rather than an overreaction. When I consider the run line at +149, the tight team profiles make me question whether Baltimore can consistently win by multiple runs against Early’s current form.
Run Environment & Game Shape
The total sits at 7.5 with slight over juice (-112), reflecting a market expectation for modest scoring in a pitcher-friendly environment. Both starters project to work deep enough innings to limit bullpen exposure, though Baltimore’s relievers carry a 4.30 ERA that could create late-inning volatility.
The park factor of 1.01 at Camden Yards creates a neutral run environment, meaning the pitching matchup drives most of the scoring expectation. With Boston averaging 4.1 runs per game and Baltimore at 4.5, the market projects a tight, low-scoring affair where small edges matter more than explosive offensive performances.
Joe Jensen’s Pick
JENSEN’S PICK: Baltimore Orioles Moneyline — 0 Units
I like Baltimore’s side here but not at -143. Bradish’s superior strikeout metrics combined with Baltimore’s seasonal offensive advantages create a legitimate edge, but the price is too steep for a standalone play. Early’s small sample success might be legitimate, making this closer to a pick’em situation than the market suggests.
I examined the run line at +149, but both teams’ tight offensive profiles and identical run differentials make margin betting questionable. This falls into the category of a good spot to watch rather than force action on an overpriced favorite.