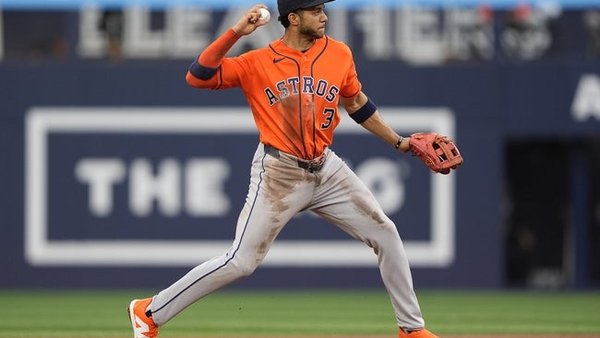
Burrows (5.58 ERA, 19 HR allowed in 90.1 IP) and Mikolas (5.44 ERA, 18 HR in 84.1 IP) are two of the more hittable arms in baseball right now, and they’re walking into lineups built around legitimate power threats. Nationals Park offers no suppression buffer, and the total is posted at 10 with flat juice — the pitch profiles carry more upside risk than that flat price acknowledges.
Mike Burrows vs Miles Mikolas: Houston Astros at Washington Nationals Betting Preview
When both starting pitchers carry ERAs above 5.40 and WHIPs that would make a pitching coach wince, the question isn’t whether runs will score — it’s how many. Mike Burrows (5.58 ERA, 1.51 WHIP, 19 HR allowed in 90.1 IP) and Miles Mikolas (5.44 ERA, 1.29 WHIP, 18 HR allowed in 84.1 IP) represent two of the more hittable rotation arms in baseball right now. This isn’t a matchup where one side is getting a dominant ace — both dugouts are working against pitchers who have struggled to prevent hard contact all season.
The numbers project a combined 9.7 runs, essentially right at the posted total of 10. That proximity makes this a volatility play rather than a gap play — the argument isn’t that the projection screams over, it’s that the individual pitcher profiles carry meaningful upside risk that a flat -110 price doesn’t adequately punish. When starters with these run-prevention numbers face power-laden lineups, the floor is higher than the number implies.
The Astros arrive in Washington having taken two of three from Tampa Bay, while the Nationals dropped two straight to Pittsburgh before opening this new series. Both offenses have the personnel to inflict damage — the pitchers on the mound tonight are the primary reason to believe they will.
Game Info & Betting Lines
- Date/Time: Monday, July 6, 2026 — 6:45 PM ET
- Venue: Nationals Park | Park Factor: 0.98 (essentially neutral, no suppression effect)
- TV: MLB.TV, Space City Home Network, Nationals.TV
- Probable Starters: Mike Burrows (HOU) — 4-8, 5.58 ERA | Miles Mikolas (WSH) — 2-7, 5.44 ERA
- Moneyline: Houston Astros +102 / Washington Nationals -120
- Run Line: Washington Nationals +1.5 (-192) / Houston Astros -1.5 (+158)
- Total: 10 (Over -110 / Under -110)
Why This Number Is Close But Leaning Wrong
The market has set the total at 10 with -110 juice on both sides, which signals genuine uncertainty about where this game lands. The case for the under isn’t nothing: Nationals Park carries a 0.98 park factor, meaning the environment itself provides no offensive inflation. Mikolas’ WHIP (1.29) is meaningfully cleaner than Burrows’ (1.51), suggesting he may strand runners more efficiently and suppress Houston’s scoring in stretches. Both closers — Josh Hader for Houston in particular — are capable of slamming the door in late innings. And the 9.7 projected total technically sits under the number, which means the projection, taken literally, points the other way.
Here’s where the market is slightly wrong, though: it’s pricing two starters as if their peripherals are symmetric, when the HR-allowed numbers tell a story about the type of damage each is susceptible to. Burrows has surrendered 19 home runs in 90.1 innings. Mikolas has given up 18 in 84.1 innings. These are fly-ball pitchers getting hit hard, and they’re facing lineups with real power depth. A neutral park doesn’t suppress home runs — it just doesn’t inflate them. With both pitchers carrying negative WAR on the season (-0.55 for Burrows, -0.48 for Mikolas), the volatility upside on the over outweighs the marginal under edge the numbers show.
What Separates the Pitching
The gap between these two arms is narrower than the ERA suggests, but it exists — and it cuts in a specific direction. Mikolas leans heavily on a sinker/fastball combination (23.7% sinker, 24.8% four-seam), neither of which misses bats at an impressive rate. His sinker generates just a 6.5% whiff rate against an xwOBA-against of 0.342 — contact-heavy, ground-oriented, but leaking hard contact when hitters sit on it. His slider (21.3% usage, 17.4% whiff) offers his best put-away option, but his changeup (8.9% usage, 0.399 xwOBA-against, 10.5% whiff) functions as a liability pitch — hitters are squaring it up when he goes there. Against the Astros lineup, that’s a problem: Yordan Alvarez carries a 0.563 xwOBA with a 10.1% barrel rate and a 31.1% hard-hit rate, and he punishes right-handed pitchers regardless of pitch type (0.569 xwOBA vs RHP). Isaac Paredes has a homer in a small BvP sample against Mikolas already. It’s worth noting that Jeremy Pena (10-Day IL, calf) and Carlos Correa (60-Day IL, ankle) are both absent from Houston’s active roster, which trims the lineup depth behind Alvarez — but Yordan himself remains the headliner, and Walker (0.781 OPS, 20 HR) and Paredes provide legitimate supporting threats.
Burrows’ profile is different but equally concerning for a different reason. His four-seam fastball — his most-used pitch at 28.5% — generates a brutal 0.404 xwOBA-against and only an 11.1% whiff rate at 94.9 mph. His changeup (26.4% usage, 31.5% whiff, 0.279 xwOBA) is legitimately his best weapon and the one pitch that holds hitters down. The problem is what happens when he misses with the fastball or the sinker (0.361 xwOBA-against) — Washington’s lineup eats those pitches up. James Wood carries a 0.579 xwOBA with an 11.3% barrel rate and a 36.0% hard-hit rate; his xwOBA against right-handed pitchers specifically sits at 0.606. CJ Abrams (0.380 xwOBA) and Luis Garcia Jr. (0.402 xwOBA, 0.410 vs RHP) follow in the order. The Nationals have the capacity to string together multiple hard-contact innings against Burrows’ flat fastball profile.
Neither pitcher creates the type of inning where a hitter is overmatched and walking back to the dugout shaking his head. Both get hit, both allow hard contact at above-average rates, and both are pitching to lineups with genuine power at the top of the order.
The Pushback
I want to be honest about the friction here. The projected total of 9.7 sits three ticks under the posted number. If I’m being purely mechanical about it, that’s a small lean toward the under, not the over. Mikolas’ WHIP improvement relative to Burrows is real — a 1.29 WHIP suggests he’s limiting baserunners more efficiently, and fewer men on base translates to fewer runs regardless of how hard contact is. The Nationals bullpen has question marks of its own, but Houston’s has been serviceable, and Hader has been elite (one run, two hits over 15 innings this season). The door-slamming potential in the seventh, eighth, and ninth is a genuine under lever.
The reason I’m leaning over anyway comes down to this: the 9.7 projection is a mean estimate. It doesn’t capture the distribution of outcomes for starters who generate this much hard contact. When Burrows’ four-seamer is getting squared up and Mikolas is leaning on a changeup with a 0.399 xwOBA-against, you’re one bad inning away from a four or five-run frame. The mean says 9.7; the tails say double-digit games happen often enough to justify -110 on the over. At flat juice, that tail risk is worth the price.
Rejected Angle: Nationals Run Line
The Nationals are -120 on the moneyline, implying a 54.5% win probability. The numbers sit even closer to a coin flip — 56.7% home win probability. At -192 on the Nationals -1.5, you’re paying significant juice for a team projected to win by essentially one run. That’s not a bet I’m making. The run line requires Washington to win by two or more, and when you’re dealing with a near-coin-flip outcome distribution and a projected margin that barely clears one run, laying -192 is just burning money on variance. The moneyline is the more defensible Washington-side play if you want exposure to the home side, but even that doesn’t excite me at -120 when the edge is that thin.
Run Environment & Game Shape
Nationals Park plays at a 0.98 park factor — essentially dead neutral, meaning whatever run environment these two pitchers create is entirely on them and not on the venue suppressing or inflating the number. In a true pitcher’s park you’d discount the ERA-based volatility argument somewhat; here, you don’t get that discount. Both starters have allowed home runs at a rate of roughly one every five innings, and Nationals Park won’t push any of those fly balls back into the outfield. The game shape is likely to be front-loaded — both pitchers tend to run into trouble rather than escape it, and neither has a reliable put-away arsenal that allows them to strand runners consistently once hitters start squaring the ball up. Expect the bullpens to inherit situations rather than clean slates.
When you stack everything together — two ERA 5.40+ starters with negative WAR, a near-neutral park providing no inflation buffer and no suppression cushion, and legitimate hard-contact threats on both sides of the lineup — the volatility argument for the over holds up even when the mean projection lands just under 10. At -110 with flat juice, I don’t need a large edge. I just need the distribution of outcomes to favor going over more often than not, and with these two arms on the mound, I think it does.
Bet: Over 10 (-110) — 2 units, moderate confidence. Two ERA 5.40+ starters, a near-neutral park, and genuine hard-contact upside on both rosters make the volatility case for the over compelling at flat juice.