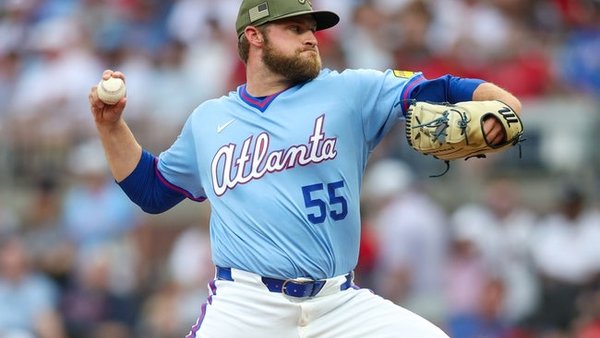
Foster Griffin’s 2.76 ERA and 1.03 WHIP represent the sharper arm in this matchup — yet Bryce Elder’s 3.96 ERA and 18 home runs allowed sit on the other side of a total set at 9. The projected combined output of 9.2 runs barely clears the number, and the under is priced at flat -110 with no juice penalty attached.
Foster Griffin vs. Bryce Elder: Washington Nationals at Atlanta Braves Betting Preview
Atlanta opened as a modest home favorite at -124, and on paper that makes sense — the Braves are 64-45, sitting atop the NL East with a run differential of +97, playing at Truist Park against a .500 Nationals team. But the moneyline narrative misses the central fact of this game: Washington is sending the better pitcher. Foster Griffin carries a 2.76 ERA and 1.03 WHIP over 124 innings this season — an ace-caliber suppression profile — while Bryce Elder sits at 3.96 ERA and 1.25 WHIP over 113.2 innings. That’s a genuine gap, and it points toward the total, not the side.
The under at 9 (-110) is where this analysis lands. The projected combined total of 9.2 runs is barely above the posted number, and Griffin’s profile against Atlanta’s .729 team OPS offense is the suppression anchor that makes the under the cleanest available angle. This is not a hammer play — the Nationals’ power surge and Elder’s HR vulnerability create real exposure — but the edge is real, and the price is fair.
Game Info & Betting Lines
- Date/Time: Friday, July 31, 2026 | 7:15 PM ET
- Venue: Truist Park | Park Factor: 1.01 (essentially neutral)
- Probable Starters: Foster Griffin (WSH, 12-2, 2.76 ERA) vs. Bryce Elder (ATL, 6-6, 3.96 ERA)
- Moneyline: Washington Nationals +106 / Atlanta Braves -124
- Run Line: Atlanta Braves +1.5 (-205) / Washington Nationals -1.5 (+168)
- Total: 9 (Over -110 / Under -110)
Why This Number Is Close
The market set 9 because it had to balance two conflicting forces. On one side, Griffin is pitching — and a 2.76 ERA starter in a neutral park against a below-average offense is exactly the profile that drags totals down. On the other side, the Nationals have 159 home runs this season and hit 48 in July alone, and Elder has surrendered 18 HR in 113.2 innings. Those are legitimate over catalysts that justify not setting the total at 8.5.
So the market is doing its job. The question is whether it got the balance exactly right. The 9.2 projection suggests the line is ever so slightly under-set — a marginal lean toward the over in raw numbers. But here’s where interpretation matters: that 0.2-run gap is within any reasonable margin of error, and Griffin’s historical suppression profile carries more weight than a half-inning of projected runs. It’s also worth noting that Atlanta’s Drake Baldwin (.857 OPS, .451 xwOBA) has filled in capably as the starting catcher while Sean Murphy (60-Day IL, finger) is sidelined — Baldwin has been a legitimate producer, so the catcher injury hasn’t cratered Atlanta’s output the way some IL losses do. The overall offensive depth is still reduced without Murphy, and the lineup’s team OPS of .729 reflects genuine inconsistency against quality arms, but Baldwin’s presence keeps Atlanta from being a pushover behind the plate.
The market priced this correctly as a tight game. The under is a lean, not a lock — and the -110 flat price means you’re not paying a premium to be right about it.
What Separates the Pitching
The gap between these two starters is wider than the ERA differential implies, and it shows up in the Statcast arsenal data. Griffin operates with a multi-plane pitch mix that generates whiffs across the zone: his changeup sits at a 34.7% whiff rate with a .280 xwOBA against, and his split-finger holds hitters to a .220 xwOBA with a 31.5% whiff rate. His cutter — used on 32.1% of pitches — generates a 17.2% whiff rate and a .317 xwOBA. This is a pitcher who controls contact quality across the lineup, not just one who misses bats occasionally.
Against Atlanta’s top-of-order, the matchup signals are favorable. Ronald Acuña Jr. is 0-for-6 with 2 strikeouts in limited BvP exposure against Griffin, and his .450 xwOBA vs. RHP is real — but Griffin’s offspeed mix is specifically designed to neutralize the kind of aggressive, pull-heavy swing that defines Acuña’s approach. Matt Olson is 1-for-6 with 2 strikeouts in BvP samples, and his .462 xwOBA vs. RHP confirms he is a legitimate threat against right-handed pitching. The reason Griffin still represents a difficult matchup for Olson isn’t that xwOBA number cratering — it doesn’t — it’s that Griffin’s low split-finger (.220 xwOBA, 31.5% whiff rate) is exactly the pitch that can exploit Olson’s 25.0% strikeout rate by working the bottom of the zone late in counts. The threat is genuine; the xwOBA just tells you the danger Olson brings, not how well Griffin can manage it with the right sequences.
Elder, by contrast, leans heavily on a sinker-slider combination — 28.1% sinker usage at 91.2 mph and 26.1% slider at 83.3 mph. The slider generates a solid 28.2% whiff rate, but his four-seam carries a .333 xwOBA against and his cutter gives up .347 xwOBA — elevated contact quality numbers against a lineup that punishes mistakes. James Wood sits at a .598 xwOBA vs. RHP and a 35.7% hard-hit rate; even with 3 strikeouts in 12 BvP plate appearances, his barrel rate of 11.0% makes Elder’s flat four-seam a genuine liability. The pitching gap is real, and it runs in Washington’s favor.
The Pushback
The concern here is not subtle. The Nationals hit 48 home runs in July — one off a franchise single-month record — and James Wood (.950 OPS, .569 xwOBA overall) is as dangerous a leadoff threat as any lineup in the NL. CJ Abrams (.926 OPS) and Luis García Jr. (.860 OPS) give Washington a top-four that can go deep on any given at-bat, and Elder’s 18 home runs allowed in 113.2 innings is a flashing warning sign. If the Nationals jump early and Elder is chased in the fourth or fifth, the bullpen dynamic changes and run totals can spike in a hurry.
There’s also the simple fact that Griffin hasn’t been tested this deep into the season. A 12-2 record with a 2.76 ERA is genuinely impressive, but park factors and lineup quality have varied — Truist Park at 1.01 is essentially neutral, so that’s not a meaningful tilt, but Atlanta’s lineup at full tilt is capable of posting four or five runs against anyone. The under at 9 assumes something close to Griffin’s season-average run-suppression, which isn’t guaranteed on any given Friday night.
And Drake Baldwin (.857 OPS, .451 xwOBA) leading off for the Braves is worth emphasizing — he’s not a liability at the top of the order. His 3 PA sample against Griffin (1 HR, 1 K) is too small to read into, but the production profile says he belongs there.
Why the Run Line and Moneyline Don’t Work
Atlanta -124 on the moneyline is a price that reflects the home-field edge and win probability without accounting for the pitching inversion. At -124, you’re laying $124 to win $100 on a team whose starting pitcher is the demonstrably worse arm in the game. The run-prevention component from the numbers actually shows a slight away advantage at the starter level. That’s not a moneyline bet — not at that price, not with these starters.
The run line at Atlanta +1.5 (-205) is even worse. Laying $205 to win $100 on a +1.5 cushion when the projected margin is essentially a coin flip is a juice trap. The -205 price requires Atlanta to cover at roughly a 67% implied rate. Nothing in this matchup supports that confidence level.
The total is the play because it’s where the Griffin edge is most directly captured — and where you’re getting fair odds to express it.
Run Environment & Game Shape
Truist Park’s 1.01 park factor is as close to neutral as it gets — this game lives or dies on the pitching and the lineup matchups, not the walls or the air. The projected run environment of 9.2 combined runs reflects that neutrality, and Griffin’s floor is meaningfully lower than Elder’s when both are operating near their season norms.
The game shape most favorable to the under is a tight, low-scoring first five innings where Griffin holds Atlanta to one or two runs and the Nationals offense generates just enough against Elder to keep it competitive without blowing the total. That’s a realistic outcome given Griffin’s suppression profile and Atlanta’s .729 team OPS. The shape most dangerous for the under is a quick Elder exit — if he’s out before the sixth, both bullpens are taxed and the run environment expands. That’s the primary risk, and it’s why this stays a 2-unit moderate-confidence play rather than a max bet.
The math is simple: Griffin is the best pitcher on the field, the price is fair at -110, and a 9.2 projection against a posted total of 9 is not enough to move me off the under given the suppression upside on the Washington side. Take the under, manage the risk, and let Griffin do the work.
Bet: Under 9 (-110) | 2 Units | Moderate Confidence