
MLB Picks
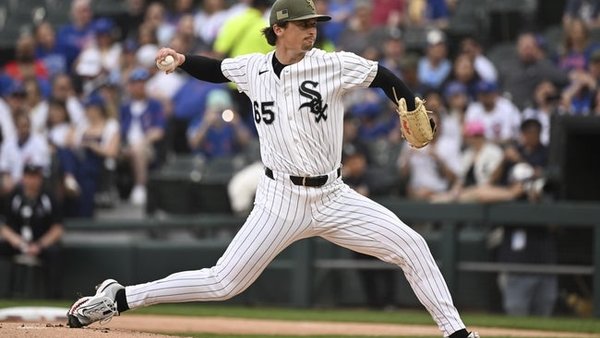
Braves vs. White Sox Pick: Two Depleted Lineups, One Flat Total
Sale’s slider is generating a 38.5% whiff rate while Baldwin (.931 OPS, 13 HR) sits on the IL — and Chicago’s Murakami (.938 OPS, 20 HR) isn’t available either. The total is posted at 7.5 with flat -110 juice on both sides, a price that hasn’t absorbed the full weight of both cleanup spots going dark. The analysis is inside.
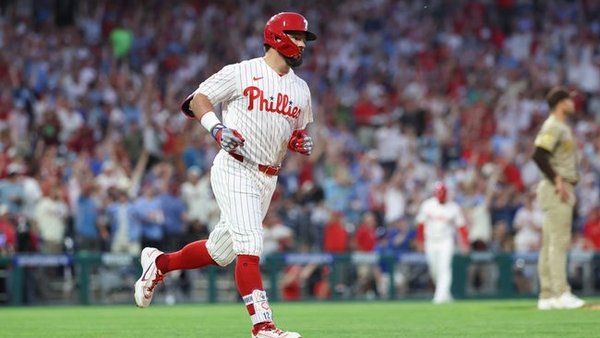
Phillies vs. Blue Jays Pick: Scherzer’s 9.64 ERA and a Total the Market Underpriced
Scherzer’s four-seamer is drawing a .412 xwOBA against and a 15.5% whiff rate — a fastball opposing lineups are sitting on and punishing. The total is parked at 8.5 with the projection sitting at 9.6 combined runs, and both sides of the over/under are priced at -110. The angle is inside.
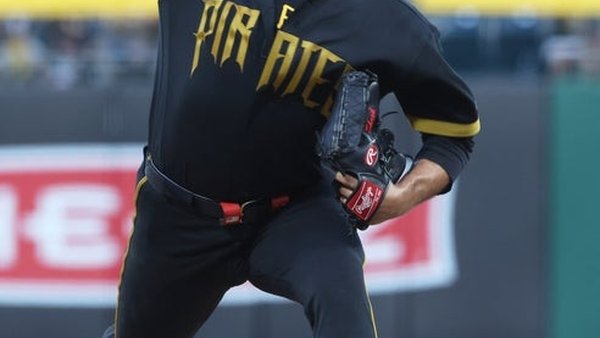
Dodgers vs. Pirates Pick: Ohtani’s 0.74 ERA Meets a Total That’s Already Priced In
Ohtani vs. Jones is a clearer mismatch than the posted total of 8 implies. The under is juiced to -114, the run projection lands at 8.3, and a degraded Dodgers lineup — missing Freeman and Hernandez — tightens the scoring environment further. The full read is inside.
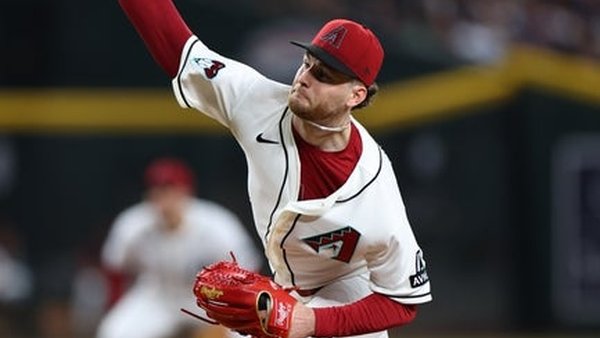
Diamondbacks vs. Marlins Pick: Gusto’s 10.80 ERA Meets a Mispriced Line
Gusto’s four-seamer carries a .430 xwOBA against in an MLB sample that shows no plus offering in his arsenal — and he’s drawing Corbin Carroll at .428 xwOBA against right-handers. Arizona sits at -110, a price that implies 52% win probability against a starter the projection model puts 18.6 percentage points below that. The breakdown is inside.
Mariners vs. Orioles Pick: Kirby’s Peripherals vs. Young’s Inflated ERA
Camden Yards’ 1.01 park factor offers no venue buffer — whatever gap exists between these two starters lands directly on the scoreboard. Young’s 3.47 ERA looks clean until the peripherals surface: a .376 xwOBA against his primary pitch and six home runs in 49.1 innings suggest a number that hasn’t caught up to the risk. The Mariners are priced at -122, a coin-flip line on a team with a +68 run differential swing over Baltimore and a two-game series lead built right here. See how this one plays out.
Reds vs. Padres Pick: King’s 3.41 ERA Meets a Depleted Lineup at Petco
The Padres’ .646 team OPS is one of the lowest marks in the dataset — a number that doesn’t show up by accident in a pitcher-friendly park. The total is posted at 8 (-110), priced as though both offenses contribute equally, but King’s 1.12 WHIP against a lineup missing De La Cruz tells a different story. Find out which way this one goes.
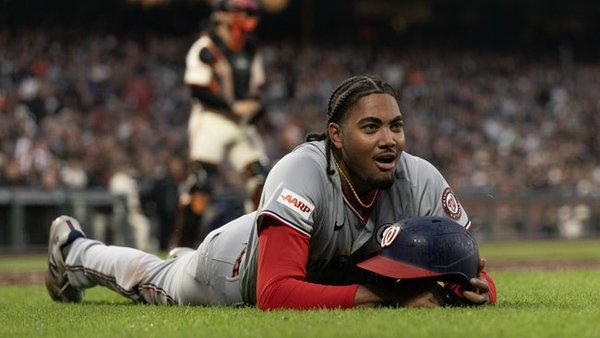
Nationals vs. Giants Pick: Griffin’s Command Edge in an Inverted Market
The bullpen gap between these two clubs is compounded by a starter mismatch the market hasn’t fully absorbed — Griffin’s 2.6 BB/9 against Ray’s near-4.8 is the kind of differential that shows up in final scores. Washington is priced at +102 despite the stronger pitching profile, while San Francisco sits at -120 propped by home-field and park factor logic that doesn’t address who’s actually on the mound. The edge is explained inside.
Yankees vs. Guardians Pick: Messick’s Command Profile vs. a Depleted Lineup
Rodon vs. Messick is a clearer mismatch than the total line implies. The market is laying -122 juice on the Over while handing out the Under at +100 — with three of New York’s most dangerous bats on the IL and a Progressive Field park factor suppressing run scoring. The analysis is inside.
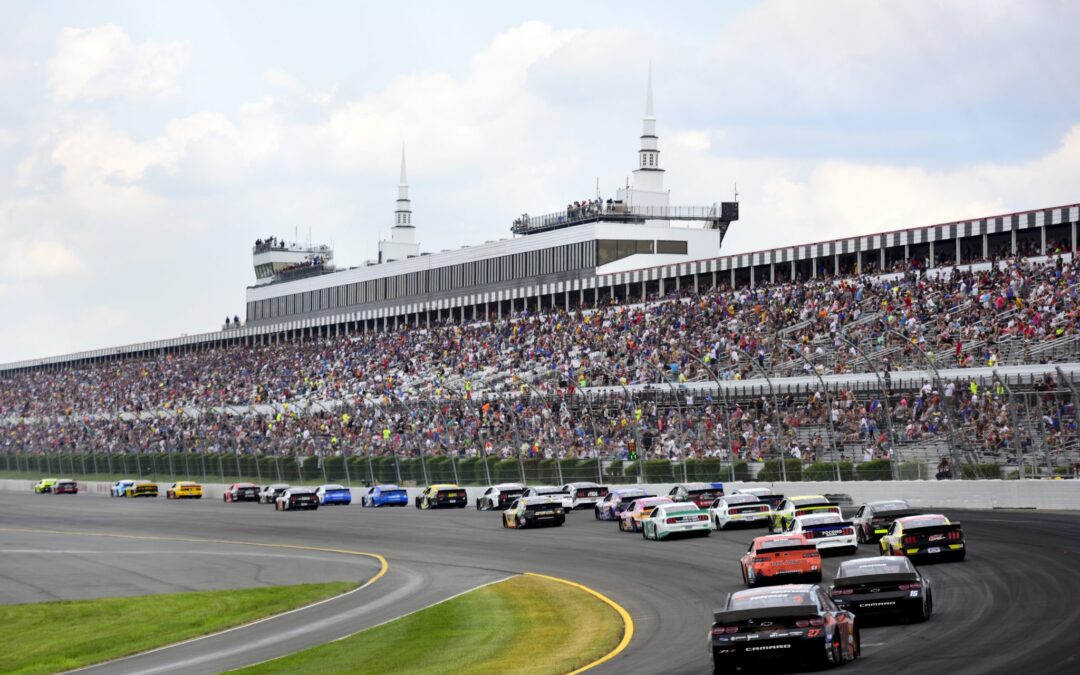
Great American Getaway 400 Picks, Odds & NASCAR Predictions for Pocono
Denny Hamlin, Brad Keselowski, and Erik Jones lead our Great American Getaway 400 betting picks and odds for Sunday’s NASCAR Cup Series race at Pocono Raceway.
Brewers vs. Athletics Pick: Ginn’s 2.74 ERA Meets a Market Still Chasing Yesterday
Las Vegas Ballpark’s run environment changes the calculus here, but not in the direction the inflated total assumes — a 0.93 park factor baseline collides with a market that overreacted to a historically rare 29-run carnival. The under is posted at +100, essentially even money on a total that sits nearly four runs above the projected combined output. The breakdown is inside.
Nationals vs. Giants Pick: Houser’s -0.81 WAR at Near-Even Money
Washington’s 5.31 runs per game against San Francisco’s 4.10 is the kind of production gap that shows up in the standings — seven games separating these clubs. The moneyline has the Nationals at -104, virtually a pick’em despite Houser sitting at a -0.81 WAR through 60.2 innings. See how this one plays out.
Reds vs. Padres Pick: Burns’ 2.05 ERA Meets Giolito’s Command Crisis
The bullpen gap between these two teams is real, but the starter gap is the headline — Giolito’s 7.0 BB/9 and 1.74 WHIP tell a different story than his ERA. The moneyline at -118 prices this like both clubs are sending out comparable arms tonight. Find out which way this one goes.
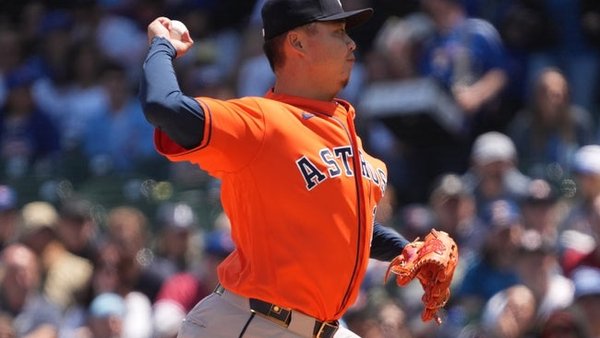
Astros vs. Angels Prediction: Teng’s Home Run Rate Meets a Pitcher-Friendly Park
Teng vs. Urena is a clearer mismatch than the -120 road price implies. Houston is favored despite a 13-percentage-point gap between the implied probability and the projected win probability — and the Angels sit at +102. The edge is explained inside.
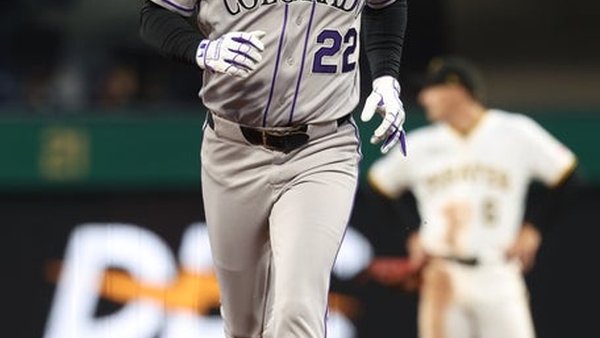
Cubs vs. Rockies Pick: Coors Field Math Outpaces a 12.5 Total
Sugano’s four-seam fastball is generating an xwOBA of .478 — a hard-contact rate that becomes a compounding problem against a Cubs lineup featuring Ian Happ’s .501 xwOBA against right-handed pitching at Coors Field. The total sits at 12.5, but Colorado’s bullpen is running a 5.60 ERA and 1.524 WHIP, and both starters project as five-inning arms at best in this environment. The analysis is inside.
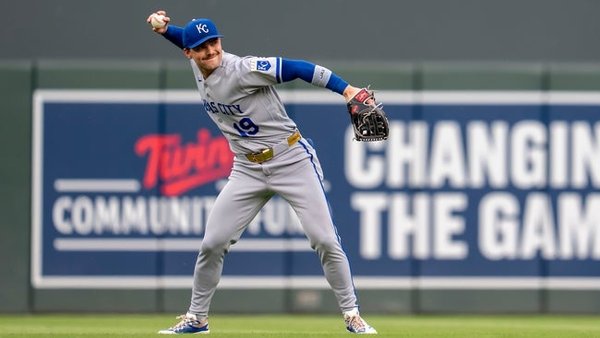
Rangers vs. Royals Pick: Kauffman’s Park Factor and a 1.1-Run Total Gap
Kauffman Stadium’s 0.95 park factor actively suppresses scoring — and this game features two offenses ranking among baseball’s weakest, with Texas at .698 OPS and Kansas City at .688. The total is posted at 9.5 while the projection lands at 8.4 combined runs, with the Under priced at -115. The pick is inside.
MLB Betting Guide
New to betting on baseball? We've got you covered! Our comprehensive how to bet on baseball article explains all the different types of wagers offered at the sportsbooks including money lines, over/unders, run lines, parlays and more! Also get tips and strategies to increase your odds of beating the bookies!